Product Page Optimization for Alkoholfrei vom Winzer: Conversion Rate From 1.8% to 3.2%
Alkoholfrei vom Winzer sells non-alcoholic wine from winemakers to customers in Germany. Skalum has worked with the shop for four years, first on SEO and content. In 2026 the next step was the product pages: wine is hard to judge on a screen, and without alcohol buyers have even more questions.
We rebuilt the product page template and filled it with real content on 100 wine pages. In September 2026, compared with September 2025, the add-to-cart rate rose from 3.5% to 5.5% and the conversion rate from 1.8% to 3.2%. Orders grew by 63% with 11% fewer sessions.
Wine without alcohol raises questions a product page has to answer
Before the rebuild, much of what buyers want to know was missing from the product pages or hidden in running text. That works for a known brand. It does not work for a dealcoholised Riesling from a winery most people have never heard of. Buyers ask the same things again and again: does it taste like wine, how is the alcohol removed, is it dry or sweet, what do I serve it with, how long does it keep once opened, is it vegan.
Shopify Analytics showed where the shop lost people. In September 2025 only 3.5% of sessions added anything to the cart, and 1.8% ended in an order. Traffic was there: the shop had 7,720 sessions that month.
The goal
Answer the buyer’s questions on the product page itself, in the founder’s voice and with the winemaker’s story, so that more visitors put a bottle in the cart. Do it for 100 wines, not for five hero products.
Four UX problems that were costing conversions
An audit of the old product pages, before any design work.

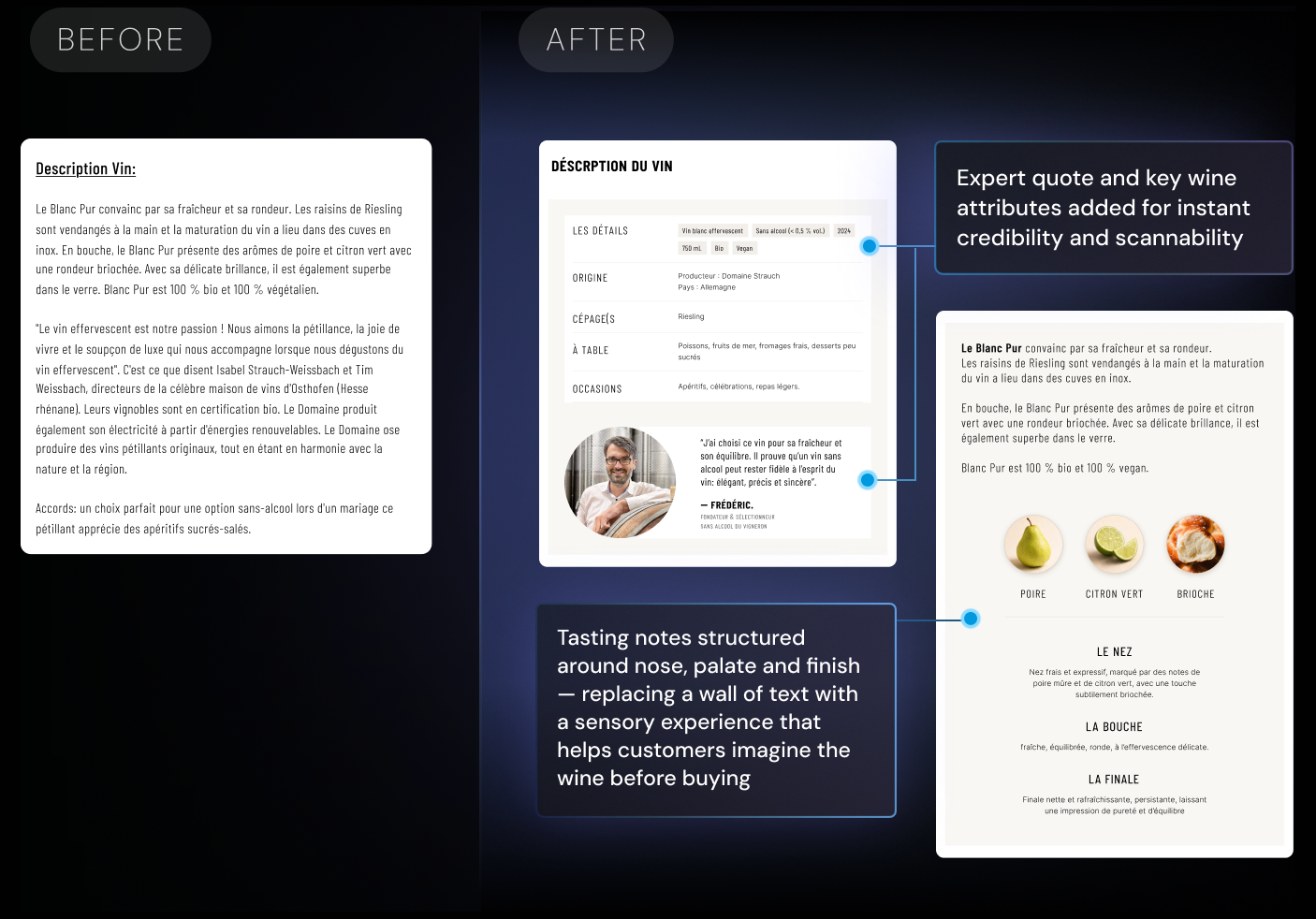
The description was generic and informational. Nothing helped the buyer imagine the taste, aroma or occasion, the core emotional triggers for wine purchases.

Information was presented as a single wall of text with no visual hierarchy or clear entry points. The nutrition table was placed before the product description.

The producer behind the wine, often an organic, family-run estate, was invisible. Trust and credibility signals were missing from the page.

No delivery timeframe, no breakage guarantee, no FAQ, no storage guidance. Once the visitor scrolled past the button, nothing addressed their doubts or brought them back to a purchase decision.
From one packshot to a gallery that sells
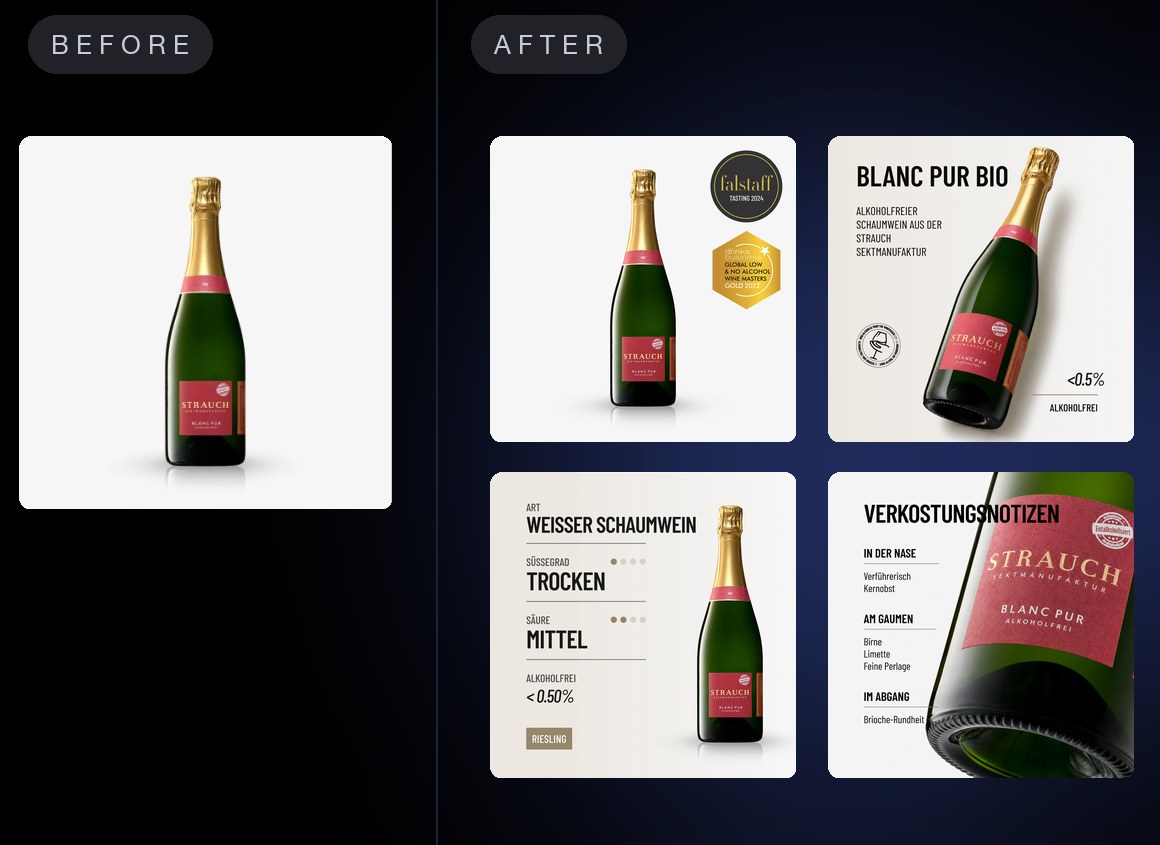
Wine is an emotional purchase, and buyers judge it first by what they see. The old gallery showed one packshot on white.
The new gallery tells the story in four images: the bottle with its real awards (Falstaff, Global Low & No Alcohol Wine Masters), the wine at a glance, a fact card with type, dryness, acidity and alcohol, and tasting notes for nose, palate and finish.
On a phone, buyers get the key facts by swiping through the images, before they read a single line of text.
Removing friction at the point of purchase
Wine is rarely an impulse buy: customers arrive with occasions in mind. The purchase block was redesigned to reflect this.
Quick-select tabs for 3 and 6 bottles match how wine shoppers naturally buy, for events and as gifts.
Delivery timeframes and a breakage guarantee answer the two most common worries about buying wine online.
A curated bundle block gives event-driven shoppers an easy upsell path without leaving the product page.
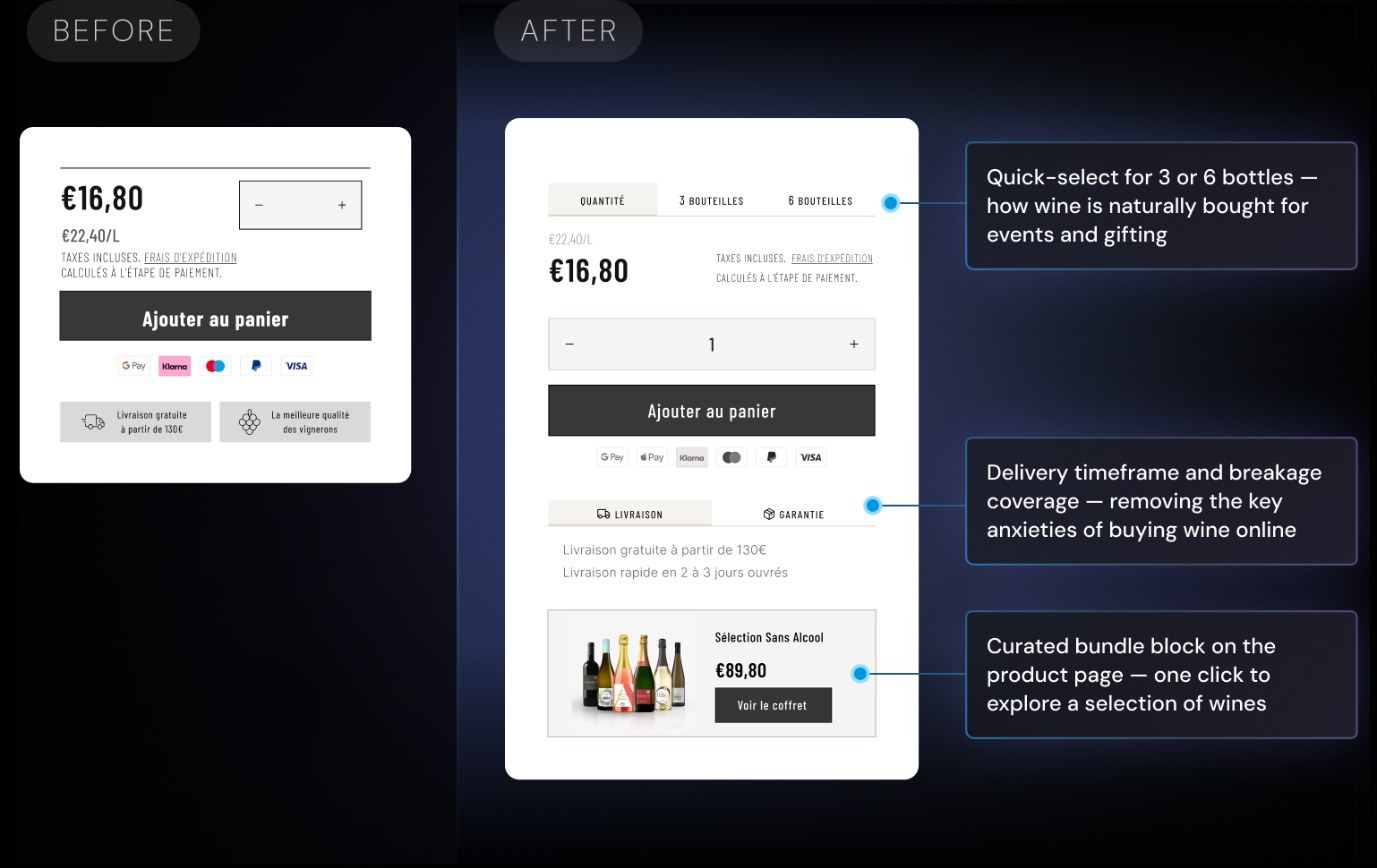
Design examples are shown on the shop’s French sister store Sans Alcool du Vigneron, which uses the same product page template.
From a wall of text to a sensory story
The old page offered one block of descriptive text: no structure, no visual hierarchy, no quick way to understand what the wine tastes like.
The new description has three layers. Technical facts such as grape, origin and serving temperature are scannable tags.
The sensory description follows nose, palate and finish and gives buyers a clear picture of the wine. A quote from the founder adds a personal layer of credibility next to the facts.
The result works on several levels: quick to scan, easy to read in depth, and engaging enough to convert customers who are still deciding.
The people behind the product
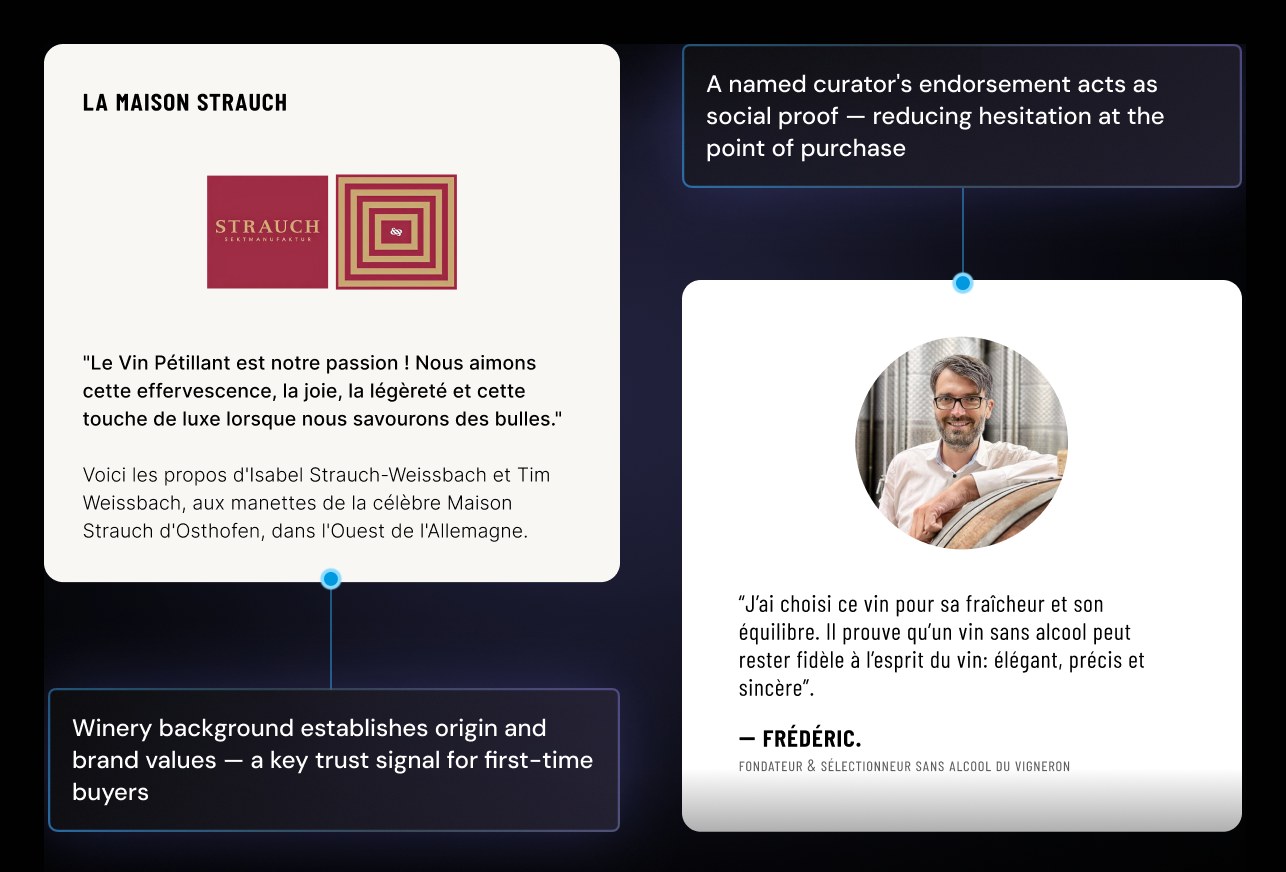
The winery story introduces the producers, their values and their craft, and gives the product a clear origin. In a category where customers are still forming their expectations, knowing who made the wine matters.
The founder’s personal recommendation is a second layer of social proof. It shows that someone who knows wine has tasted this one and stands behind it. The customer’s question shifts from “can I trust this product?” to “someone I can relate to already did.”
Together these elements create the human context that turns a product page into a credible buying experience.
Results: September 2025 vs September 2026
All numbers from Shopify Analytics for the online store. September 2026 is the latest full month, with the new template live and the content rollout under way.

Add-to-cart rate
up from 3.5% in Sep 2025
Conversion rate
up from 1.8% in Sep 2025
Net sales
€23,104 → €36,995
- Orders: 276 → 450 (+63%), with 7,720 → 6,895 sessions (−11%).
- Average order value stayed stable: €84 → €83. The growth came from more buyers, not from bigger baskets.
- Not one lucky month: July to September 2026 vs 2025, the conversion rate rose from 1.93% to 2.91% and net sales from €70.0k to €97.0k (+39%).
Add-to-cart and conversion rate, June 2025 to September 2026
The chart shows every month, not just the two we compare. Blue bars: share of sessions that added a product to the cart. Green bars: share of sessions that ended in an order.
| Metric (online store) | Sep 2025 | Jun 2026 | Sep 2026 | Sep vs Sep |
|---|---|---|---|---|
| Sessions | 7,720 | 7,429 | 6,895 | −11% |
| Add-to-cart rate | 3.46% | 4.77% | 5.53% | +60% |
| Conversion rate | 1.80% | 2.76% | 3.16% | +76% |
| Orders | 276 | 366 | 450 | +63% |
| Net sales | €23,104 | €35,576 | €36,995 | +60% |
| Average order value | €84 | €97 | €83 | −1% |
What we can and cannot claim
The conversion rate had been rising since late 2025, and SEO and email work continued in parallel. So we do not claim that every extra order came from the product pages. What the data does show: from June to September, the add-to-cart rate, the metric a product page drives most directly, fell from 4.08% to 3.46% in 2025. In 2026, with the new pages live, it rose from 4.77% to 5.53%, while traffic went down.
Conversion rate here is Shopify’s session-based rate: sessions with a completed checkout divided by all sessions. Orders come from Shopify’s sales report, which counts every order. Shopify Analytics only records sessions where visitors allow tracking, which is why there are more orders than sessions with a completed checkout, and why these session counts are lower than the search traffic in our SEO case.
Good product pages answer questions before they are asked
For Alkoholfrei vom Winzer the product page became the place where a hesitant buyer gets every answer: how the wine tastes, who made it, how to serve it and what the founder thinks of it. Conversion rose from 1.8% to 3.2% and orders by 63%, with fewer visitors than a year before.
The method works for any shop with products that need explaining. If you want to know what your product pages are missing, start with a CRO audit or see our conversion rate optimisation services.
Frequently asked questions
It means changing the product page so that more visitors add the product to the cart and buy: clearer facts near the price, answers to common questions, trust from real people, and a layout that works on a phone. In this case it covered the template and the content on 100 product pages.
In September 2026 the conversion rate of the online store was 3.16%, compared with 1.80% in September 2025. The add-to-cart rate rose from 3.46% to 5.53%. Over July to September the conversion rate rose from 1.93% to 2.91%.
No, and we do not claim that. SEO and email work ran in parallel and the conversion rate had been rising since late 2025. After the new pages went live, the add-to-cart rate, which the product page influences most directly, rose from 4.77% in June to 5.53% in September 2026. In the same months of 2025 it fell.
The new template was built on a development theme from June 2026 and went live in summer 2026. The content for 100 product pages followed from August to October 2026.
From Shopify Analytics for the online store: sessions, sessions with add to cart, sessions with a completed checkout, orders and net sales per month. October 2026 is left out because the month was not finished when we wrote this case.
Yes, if your products need explaining: food and drink, cosmetics, technical goods, anything with questions before the purchase. We start with an audit of your product pages and your own data, then build a concept you can click before anything goes live.